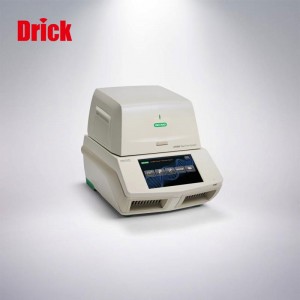
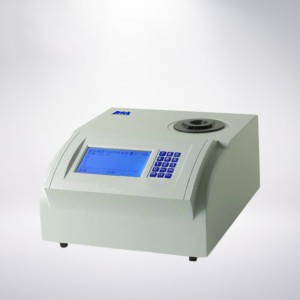
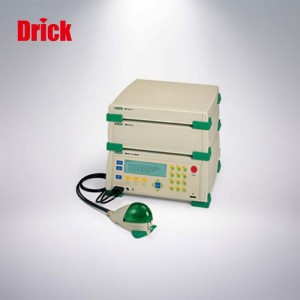
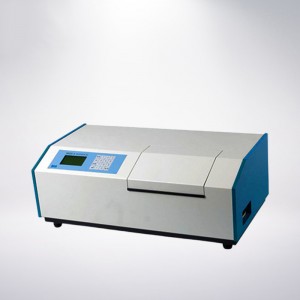
CFX96TOUCH Fluorescent Quantitative PCR instrument
The CFX96Touch fluorescent quantitative PCR can be used in a variety of research fields of nucleic acid quantification, gene expression level analysis, gene mutation detection, GMO detection, and product specific analysis.
Working Environment:
1.1 Working temperature: 5-31 ° C
1.2 Working and humidity: relative humidity ≤80%
1.3 Working power: 100-240 VAC, 50-60Hz
Performance and technical requirements of CFX96Touch fluorescence quantitative PCR
3.1 Main performance (* is the indicator that must be met)
* 3.1.1 Six test channels, 5% PCR can be realized, and 5 target genes can be detected at the same time, and the special FRET detection channel is simultaneously detected.
* 3.1.2 With the dynamic temperature gradient PCR function, you can run 8 different temperatures at the same time, each temperature incubation.
3.1.3 Opening of complete reagents, various research and clinical reagents apply;
3.1.4 Suitable for a variety of fluorescence methods such as Taqman, Molecular Beacon, Fret probe, Sybr Green i, etc .;
3.1.5 Open, 0.2ml single tube, octal, 96-well plate, etc.
* 3.1.6 can run independently, truly offline operation, no need to connect the computer to monitor the PCR fluorescent amplification curve in real time;
3.2 Main technical requirements (* is the indicator that must be met)
* 3.2.1 Sample capacity: 96×0.2ml, standard specifications 96-well plates (12×8) can be used;
3.2.2 Supplies Type: 0.2ml single tube, eight interlocking, 96-well plates, etc.
3.2.3 Reaction System: 1-50μL (recommended 10-25 μL);
* 3.2.4 Light source: Six LEDs with filters;
* 3.2.5 Detector: Six photosensitive diodes with filters;
* 3.2.6 liter cooling speed: 5 ° C / sec;
3.2.7 Temperature control range: 0 -100 ° C;
3.2.8 Temperature Accuracy: ± 0.2 ° C (90 ˚C);
3.2.9 Temperature uniformity: ± 0.4 ° C (90 ˚C within 10 seconds);
* 3.2.10 Dynamic Temperature Gradient Function: Run 8 different temperatures at the same time; gradient temperature control range: 30 -100 ° C; gradient temperature difference range: 1 – 24 ° C; gradient temperature incubation time: the same;
3.2.11 excitation / emission wavelength range: 450-730 nm;
3.2.12 Sensitivity: Single copy gene in human genome can be detected;
3.2.13 Dynamic range: 10 quantities;
3.2.14 Display: 8.5 inch color touch screen;
3.2.15 Data Analysis Mode: Standard Curve Quantity, Melting Curve, CT or ΔΔCT Gene Expression Analysis, Multiple Internal Genodes Analysis and Amplification Efficiency Calculation, Multiple Data Files Gene Expression Analysis, Allelic Analysis, Type Analysis, Have Gene, melting curve analysis function;
3.2.16 Data Export: Excel, Word, or PowerPoint. The user report contains run settings, graphics, and table data results, which can be printed or saved as PDF;
* 3.2.17 Chromosomal structure studies: A method of quantitative analysis of chromatin structures by comparative role of genomic DNA degradation by comparative role of genomic DNA. It truly proves the height correlation between the chromatin structure and gene expression;
Products categories
-

Phone
-

E-mail
-

Whatsapp
-

Top
